
BNSF freight volumes increased in the third quarter of 2026, according to Berkshire Hathaway’s quarterly report and FreightWaves coverage published November 9. For importers considering an inland rail connection, the useful detail is not simply that the railroad grew. It is what the reported volume categories actually measure.
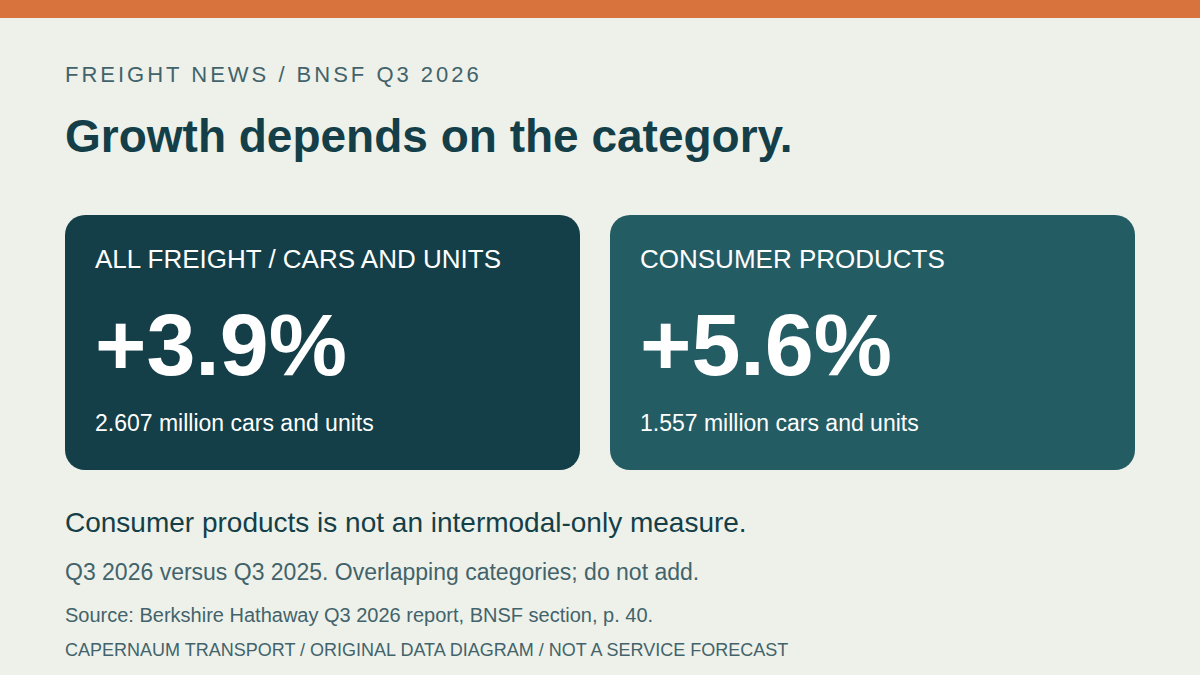
Berkshire’s third-quarter 2026 report, BNSF section on printed page 40, shows total freight volume of 2.607 million cars and units, compared with 2.508 million a year earlier, an increase of 3.9%. Consumer-products volume increased 5.6%, to 1.557 million cars and units from 1.474 million.
Consumer products is not an intermodal-only count
The company attributed the consumer-products volume increase primarily to higher intermodal shipments resulting from higher West Coast imports and tightening truck capacity. That is Berkshire’s explanation of its quarterly results, not a current capacity assessment by Capernaum.
Keep the category and the explanation distinct. The table reports consumer-products cars and units. It does not identify the 5.6% change as a stand-alone intermodal growth rate. Nor is the overall 3.9% figure an import-container growth rate: it includes the railroad’s other freight groups. Describing either percentage as growth in all U.S. imports would overstate the evidence.
Revenue growth measures something different again
Railroad operating revenue increased 14.7%, to $6.870 billion from $5.988 billion. Berkshire said average revenue per car or unit increased 10.5%, primarily from higher fuel surcharge revenue and higher yield. Revenue growth therefore should not be presented as if it were entirely additional freight moving through the network.
FreightWaves’ November 9 report independently covers the same earnings disclosure, including the 3.9% volume increase and 14.7% revenue increase. It is reporting on company results, not an independent audit. We checked the primary report for the exact totals, category labels and explanation above.
Translate the disclosure into a better routing question
For a shipper, these results provide context for a discussion about inland transportation. They do not establish transit time, terminal availability, a rate or equipment for a particular shipment. They also do not prove that moving a load from truck to rail will reduce its cost or meet its delivery deadline.
Our operational recommendation is to request a route-specific comparison rather than select a mode from a growth headline. Ask the provider to identify the actual origin and destination ramps, the proposed rail service, the road legs at both ends and the receiving requirements. Distinguish a proposed routing from a confirmed booking.
- Check the category: If someone cites the 5.6% figure, label it consumer-products car/unit growth, not an intermodal-only or nationwide import statistic.
- Check the period: These figures compare July through September 2026 with the same quarter in 2025. They are not a reading of today’s terminal conditions.
- Check the offered service: Ask what the proposed movement includes, which timing information is estimated and who is coordinating each road connection.
- Check the full scope: Compare the same cargo, locations, handling needs and receiving constraints across offers. The reported railroad revenue increase is not a quoted customer price change.
Keep the shipment decision separate from the headline
Our drayage guide explains the local container leg. To discuss a move with Capernaum, share the cargo, origin, destination and timing, including any proposed rail routing. Scope and availability need shipment-specific confirmation. No BNSF affiliation or access to its capacity is implied.
Sources and scope
Published 2026-11-09. FreightWaves published its linked report November 9, 2026. Berkshire Hathaway’s third-quarter 2026 report covers the period ended September 30, 2026; no separate web publication date is asserted here. Both sources were directly checked November 9. The primary BNSF table and accompanying discussion support the figures, category distinctions and company-attributed explanation. Planning suggestions are original editorial analysis. No interviews, customer outcomes, investment recommendation, third-party artwork or current rate or capacity forecast is claimed.