
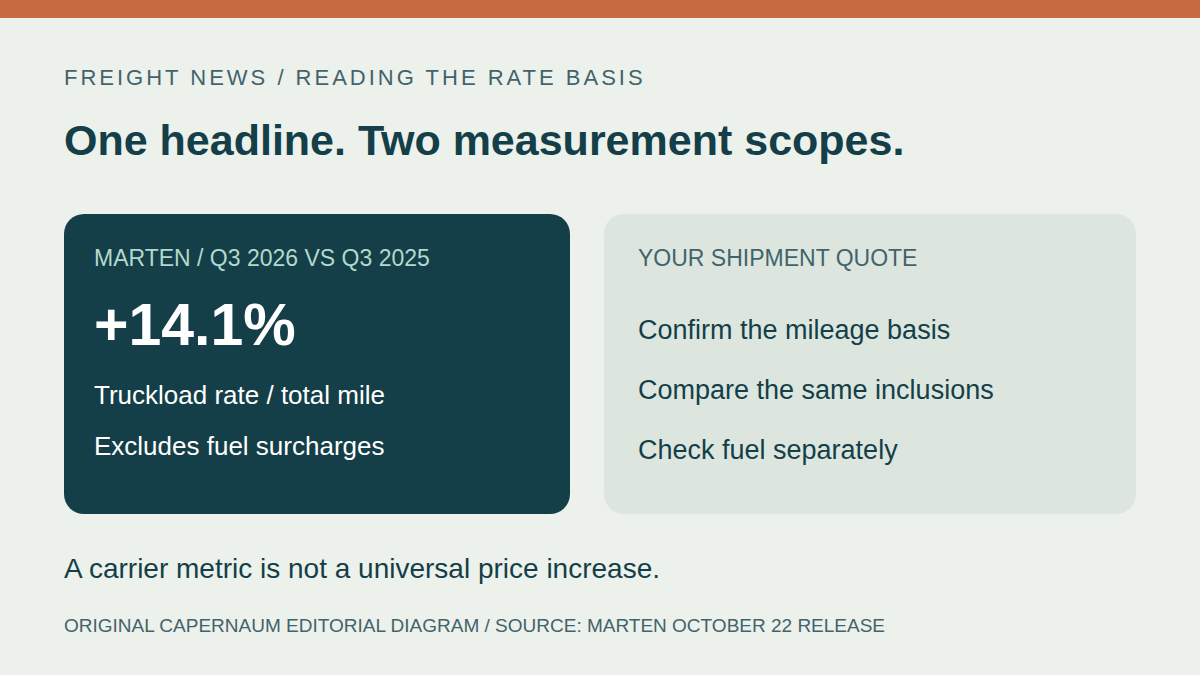
Marten’s truckload rate gain is back in focus after Trucking Dive’s November 10 report on the carrier’s third-quarter results. The figure is specific: Marten says its truckload average rate per total mile, net of fuel surcharges, increased 14.1% from the third quarter of 2025. It is not a published increase for every shipper or lane.
What the primary release actually measures
Marten’s October 22 earnings release directly supports that 14.1% figure. The comparison covers the quarter ended September 30, 2026 against the same quarter a year earlier. The wording matters: it describes the company’s truckload segment, uses total miles and excludes fuel surcharges.
The same release lists truckload total miles of 34.825 million in the 2026 quarter, versus 38.081 million in the 2025 quarter. Average truckload tractors were 1,507 versus 1,661. These are company-specific quarterly operating statistics, not a live count of available trucks. Trucking Dive independently reports the rate improvement alongside a smaller fleet and fewer miles.
Those figures can coexist: a carrier can report a higher rate measure while moving fewer total miles. Neither measure alone tells a shipper the price or availability of the next load. We have not independently measured the wider truckload market and are not treating management’s broader market commentary as a verified market index.
Total miles are not the same as one booked road leg
The release also reports truckload non-revenue miles of 10.7% for the 2026 quarter and defines that measure as miles for which the company is not compensated. The rate statement says total miles, not simply the distance printed on an individual shipment quote. Do not silently relabel the reported figure as a loaded-mile rate.
A shipper comparing this headline with a proposal needs the proposal’s own basis. Our recommendation is to ask what distance measure the quote uses and which services are included. The earnings percentage does not establish a universal method for quoting freight, and it is not a substitute for the carrier’s written commercial terms.
Keep the fuel exclusion visible
The 14.1% comparison is net of fuel surcharges. It therefore should not be described as a change in an all-in freight bill. Marten’s release presents fuel surcharge revenue separately and discusses the effect of fuel costs on its own earnings. Those disclosures do not supply a Capernaum surcharge formula or determine any customer’s bill.
For a current proposal, identify the base transportation amount, the applicable fuel treatment and any separately priced handling or delivery requirements. Compare the same inclusions across proposals. A change in one excluded component can make an all-in comparison differ from a base-rate comparison; no specific surcharge or price change is calculated here.
A short comparison brief for the next quote
- Name the observation: Record the carrier, truckload segment, quarter, year-over-year comparison and fuel exclusion beside the headline percentage.
- Name the shipment: Provide origin, destination, cargo, packed dimensions, weight, timing and handling requirements for the actual move.
- Ask for the price basis: Confirm whether the proposal is a shipment total or a distance-based amount, and what mileage definition applies if relevant.
- Reconcile inclusions: Check fuel and any separately priced services without assuming that two offers cover identical work.
- Confirm availability separately: Treat acceptance and timing as shipment-specific confirmations, not consequences of a quarterly fleet statistic.
This is original planning guidance, not a recommendation to accept a percentage increase or change providers. Our fuel benchmark and freight-bill explainer covers a related distinction. To discuss a shipment with Capernaum, send the operating details rather than using an earnings headline as a target rate. Service scope and availability require confirmation; no affiliation with Marten is implied.
Sources and scope
Published November 11, 2026. The news peg is Trucking Dive’s November 10 (2026-11-10) coverage of results released October 22, not a new November 11 earnings announcement. Both sources were directly checked November 11. Marten’s publicly accessible PDF was downloaded and its text extracted to verify the reporting period, 14.1% rate statement, total miles, tractors and non-revenue-mile definition. The publication independently supports the central rate-and-mile contrast. No interviews, personal attendance, publisher prose or publisher imagery are claimed or reused. The recommendations and illustration are original editorial work. No current lane rates, capacity forecasts or customer outcomes are asserted.