
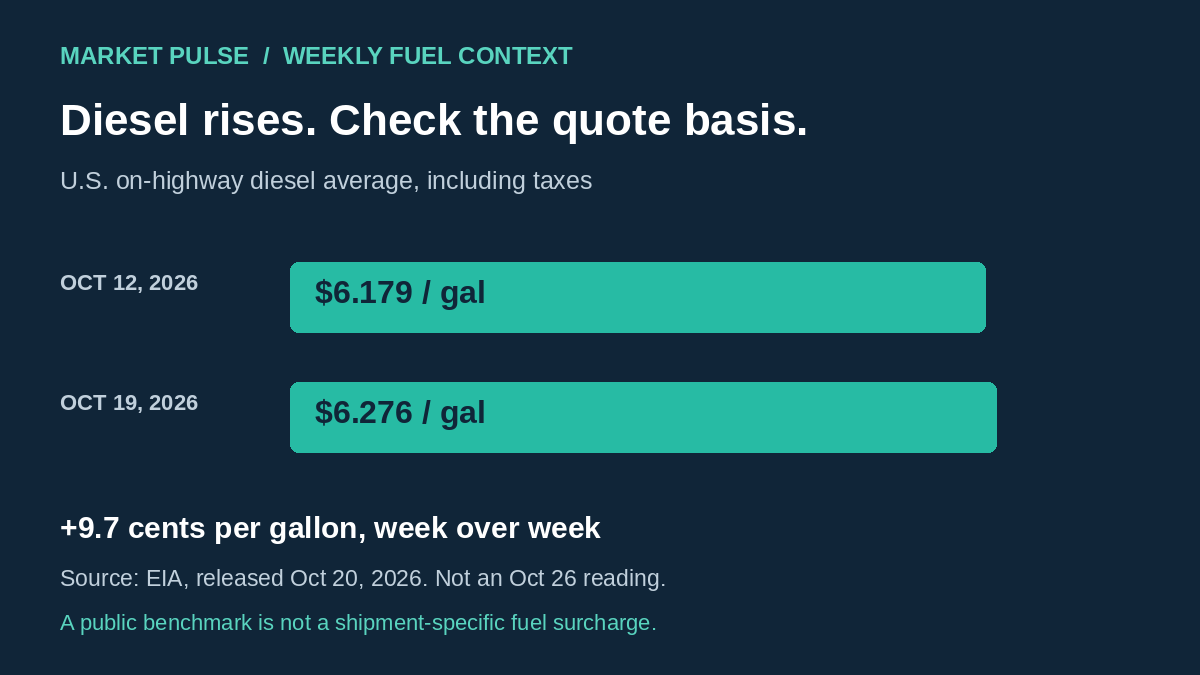
The weekly diesel benchmark rose in EIA's latest published release, but that is a reason to check the basis of a freight quote, not to apply a universal surcharge. For U.S. shippers planning container pickups, regional deliveries or replenishment loads, the useful distinction is between a public fuel observation and the terms of a particular transportation agreement.
What the latest weekly diesel release shows
The U.S. Energy Information Administration's gasoline and diesel update, released October 20, 2026, lists the U.S. on-highway diesel average for October 19 at $6.276 per gallon, including taxes. That compares with $6.179 on October 12, an increase of 9.7 cents per gallon.
These are weekly observations, not a new October 26 price reading. Checked at 08:17 a.m. Eastern on October 26, the page still identified October 20 as its diesel release date and October 27 as the next release date. This article does not anticipate the next observation.
The regional figures also differ. The October 19 Central Atlantic average was $6.508 per gallon, versus $5.903 for the Gulf Coast. Those are broad regional survey estimates, not a quote for a particular fuel stop or a measure of the cost of a specific New Jersey shipment.
A pump-price benchmark is not a trucking rate
EIA's methodology describes a weekly sample of retail outlets and volume-weighted estimates. The surveyed price is the cash self-serve pump price, including taxes. It does not measure truck availability, warehouse handling charges, terminal waiting time or the full cost of moving a load.
The national week-to-week change therefore cannot be applied directly to an invoice total or converted into a per-mile fuel charge without the applicable agreement. A quoted fuel component may use a specified index, reference period and calculation. Shippers should establish those details with the quoting provider rather than substitute the most recent headline number.
Three checks before comparing inland quotes
- Match the reference period. Ask which fuel benchmark and observation date underpin each quote. Quotes prepared on different dates may not use the same weekly input. Keep the quote's validity and the planned service date visible.
- Separate the components. Confirm whether fuel is included in the stated transportation price or listed separately. Ask what other services or conditional charges are excluded, rather than assuming a lower linehaul figure means a lower total.
- Keep the shipment assumptions consistent. Compare the same origin, destination, equipment needs and receiving conditions. For container delivery, confirm pickup readiness and the receiving appointment independently of the fuel discussion.
Our guide to diesel prices versus the freight bill explains the broader distinction. This dated update adds the latest checked weekly observation; it does not replace the terms of an existing agreement.
For Newark-area container planning, protect the handoff
A fuel update does not establish whether a container is available, whether a truck has been confirmed or whether the receiver can unload at the intended time. Keep those checks in the shipment plan. If an arrival or receiving appointment changes, send the revised details to the responsible parties and confirm the next handoff before treating the original plan as unchanged.
That is an operational planning recommendation, not a claim that current port congestion, detention charges or capacity shortages have been observed. No live capacity dataset or shipment-specific cost model is used here.
For an upcoming move, contact Capernaum with the pickup and delivery locations, cargo details, timing and receiving requirements. Ask for a shipment-specific scope and price breakdown. Fuel surcharge treatment varies by agreement; this article supplies no universal formula or applicable per-mile charge.
Sources and scope
Primary data: EIA Gasoline and Diesel Fuel Update, release date 2026-10-20, observation date 2026-10-19. Methodology checked October 26, 2026. The second EIA source explains the survey, not independent confirmation of the price figures. This is original operational analysis, not a forecast, a Capernaum rate announcement or a customer case study. The chart is an original graphic based on the two cited U.S. observations.