
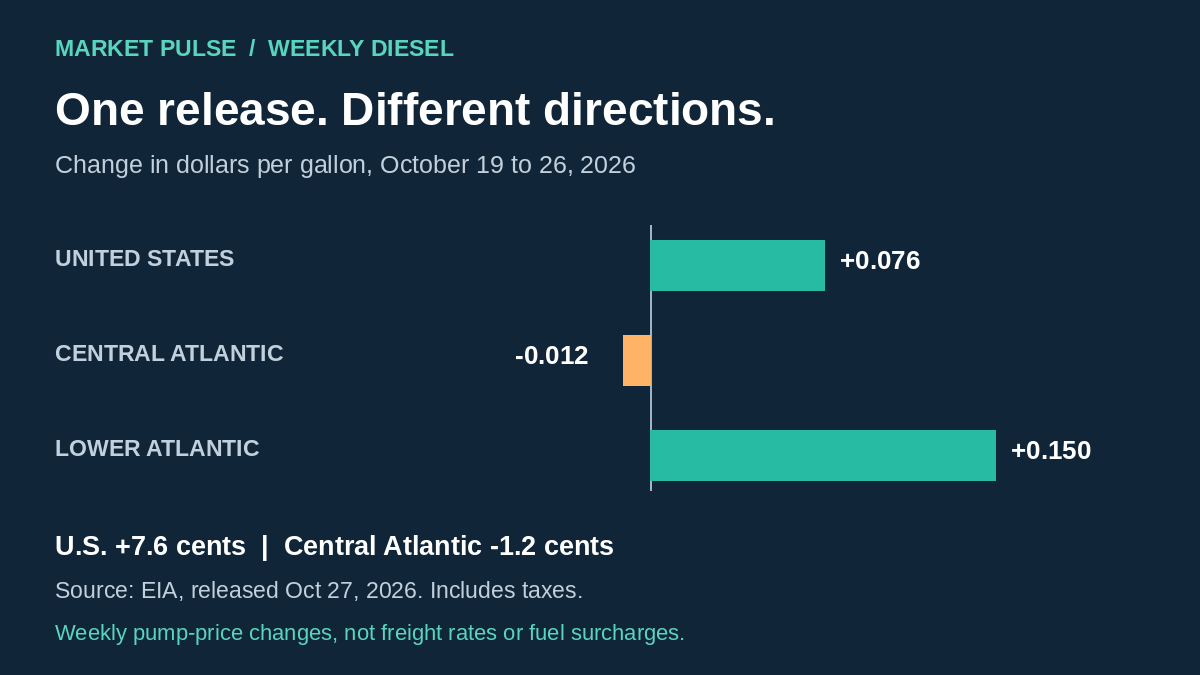
Regional diesel prices moved in different directions in EIA's October 27 release. The U.S. average rose, while the Central Atlantic estimate edged lower. For a shipper comparing a New Jersey pickup with a delivery farther south, the practical lesson is not to select the cheaper index. It is to identify the index the transportation agreement actually uses before explaining a change in the fuel component.
The October 26 observations do not tell one regional story
The U.S. Energy Information Administration's Gasoline and Diesel Fuel Update, released October 27, 2026, reports these on-highway diesel estimates, including taxes:
- United States: $6.352 per gallon on October 26, compared with $6.276 on October 19. The weekly increase was 7.6 cents.
- Central Atlantic: $6.496 per gallon, compared with $6.508. The weekly decrease was 1.2 cents.
- Lower Atlantic: $5.890 per gallon, compared with $5.740. The weekly increase was 15.0 cents.
The distinction between level and change matters. Central Atlantic diesel was still more expensive than the national average in this release, even though its weekly movement was downward. A higher regional price does not mean that region recorded a weekly increase.
These are October 26 observations published October 27, not new daily readings for October 28. The source was checked October 28. This is a new weekly release, separate from our October 19 benchmark analysis.
Choose the agreed reference, not the convenient headline
A national increase and a regional decrease can both be accurate. That does not create a choice of which number to apply to a shipment. If an agreement specifies the U.S. average, a local decline alone does not establish that the agreement's fuel charge should fall. Conversely, a national headline does not explain a charge calculated from a different regional series.
For a New Jersey shipper, the useful question is: which named series and observation date does this quote reference? Do not assume that the pickup location determines the index, or that a move between regions should use an average of their published prices. Neither conclusion follows from the EIA table.
Keep four dates on the quote record
For this release, October 26 is the observation date and October 27 is the publication date. The quote date and the service date are separate commercial details. A comparison becomes unreliable when one quote uses an earlier weekly observation and another uses the latest release without making that difference visible.
- Identify the series and observation. Record the benchmark name, geography and dated value cited by the provider.
- Check the effective period. Confirm which week applies under the agreement and how long the quoted terms remain valid. The newest public release is not automatically the applicable contractual input.
- Keep the total scope comparable. Confirm whether fuel is included or separate, and compare the same shipment and receiving assumptions. A different index is not the only possible reason two totals differ.
A regional fuel estimate is not a lane-cost forecast
EIA's diesel methodology describes a survey of cash self-serve pump prices, including taxes, at sampled retail outlets. It produces volume-weighted estimates. Those regional estimates do not report the price a particular carrier paid, the route it will fuel on, or the truck capacity available for a shipment.
This week's opposite regional movements therefore do not establish that a New Jersey-to-southern-state shipment became cheaper or more expensive overall. No lane-cost model, fuel purchasing record or current capacity dataset is used here. The table also does not establish a cause for the divergence, so this analysis does not attribute it to port activity, a refinery event or a demand shift.
For an upcoming container pickup or regional delivery, contact Capernaum with the origin, destination, cargo, timing and receiving requirements. Ask for a shipment-specific scope and a clear explanation of the fuel basis. Fuel surcharge treatment varies by agreement; no universal formula or applicable per-mile charge is supplied here.
Sources and scope
Source: U.S. Energy Information Administration, Gasoline and Diesel Fuel Update, release date 2026-10-27; observations 2026-10-19 and 2026-10-26. Data and methodology checked October 28, 2026. The methodology is context from the same agency, not independent confirmation of the figures. This standalone article is original operational analysis of a primary public dataset, not a forecast or a Capernaum rate announcement. The featured graphic is original and shows weekly changes, not absolute prices or freight rates.